Introduction
I recently came across The WebGL Globe released by the Google Data Arts Team and thought it would be cool to bring into the teams' visualisation toolkit.
Heavily leveraging the Javascript three.js 3D library, it provides a nice, interactive rendering of non-negative measures by global geographic location. This post steps through how to get this up and running on your machine including how to host this visual on a simple http web-server using Python.
Step 1:
Have a look at Google's example showing global population growth in the 20th century. To display your data in this way, showing a change in magnitude over years of fixed locations, you will need your input data arranged in json format as follows:[
[ "YearA", [latitude_1, longitude_1, magnitude_1A, latitude_2, longitude_2, magnitude_2A, ... ]
]
, [ "YearB", [latitude_1, longitude_1, magnitude_1B, latitude_2, longitude_2, magnitude_2B, ... ]
]
...
]
- 1. The [latitude, longitude, magnitude, ...] triples are the fixed locations with changing measure values across the years. Note that the json file must have the same geographic locations across all years
- 2. For best visualisation results the magnitude values should be <= 1
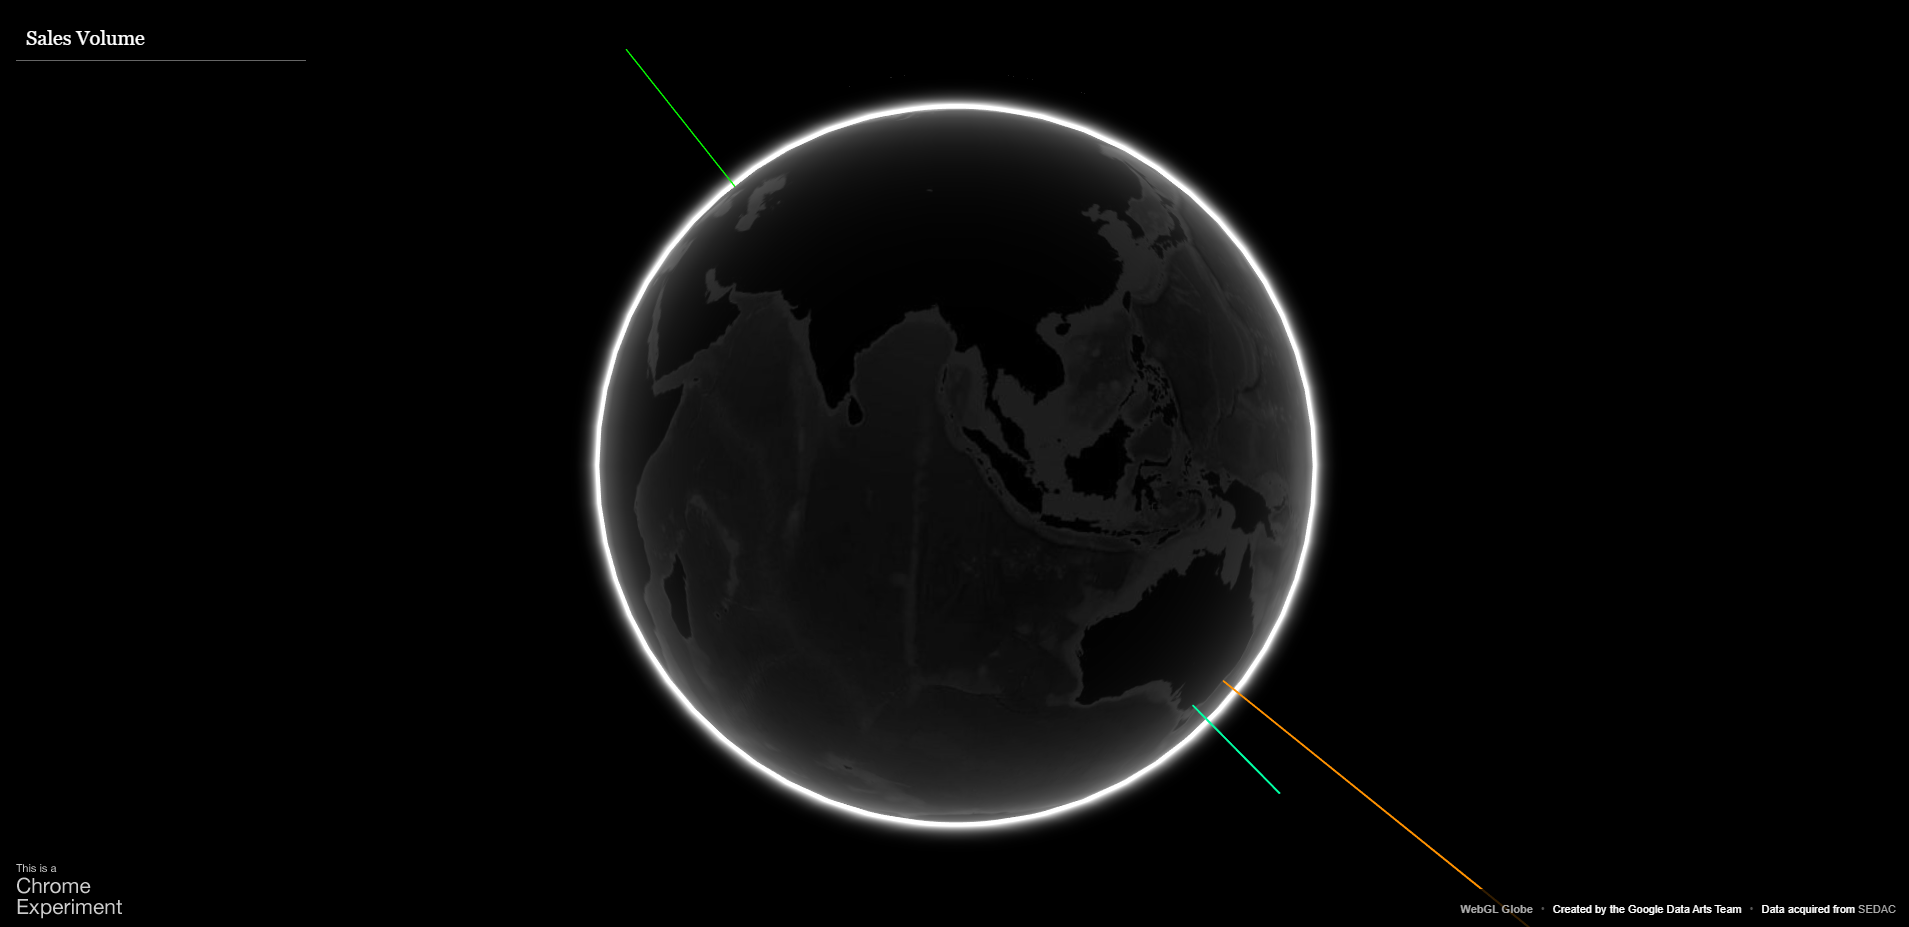
As a simple example you may want to display only the most recent measure (i.e. only 1 year) across locations say if your data looked like Table 1:
| Location | Annual Sales |
|---|---|
| London | 50 |
| Sydney | 94 |
| Melbourne | 34 |
| Boston | 14 |
| New York | 7 |
In which case your input data should look like the below:
[
[ "YearA", [51.5, -0.12, 0.54, -33.8, 151.2, 1.01, -37.8, 144.9, 0.32, 42.3, -71.0, 0.09, 40.7, -74.0, 0.01]
]
]Where the sales have been normalised to (close to) a [0,1] range and the latitude/longitudes correspond to the above cities.
| Location | Latitude | Longitude | Annual Sales | Normalised Annual Sales |
|---|---|---|---|---|
| London | 51.5 | -0.12 | 50 | 0.54 |
| Sydney | -33.8 | 151.2 | 94 | 1.01 |
| Melbourne | -37.8 | 144.9 | 34 | 0.32 |
| Boston | 42.3 | -71.0 | 14 | 0.09 |
| New York | 40.7 | -74.0 | 7 | 0.01 |
There are also some corresponding small amendments that need to be made to index.html . This is described in more detail in Step 4 below
Step 2:
Download the 'globe' folder from the Data Arts GitHub page. By default index.html refers to the file location ~/globe/ so move index.html into the folder location one level above the globe folderThe two files you will need to edit are:
- 1. index.html which is what you will need to edit to customise the globe
- 2. population909500.json which is the input data file in json format described above
Step 3: Implementing in Python
Link to my GitHub repo: Hosting-WebGL-Globe
Get this 'out of the box' version running on your machine. If you simply double-click on the index.html file you will get a static web-page with no globe. To get the globe to resolve you can host a local web server on your machine using Python which will display the contents of the index.html file (i.e. the Globe) to you. Once you get this baseline version up and running the editing of index.html and the creation of your bespoke json input file are largely straight-forward to do.
The below few lines of Python code sets up a local web-server on your machine:
	#~~~~~~~~~~~~~~~~~~~~~~~~~~~~~~~~~~
	# Filename: PythonHTTPServer.py
	# Title: Sets up a local web server
	#~~~~~~~~~~~~~~~~~~~~~~~~~~~~~~~~~~
	import http.server
	import socketserver

	PORT = 8000

	Handler = http.server.SimpleHTTPRequestHandler

	httpd = socketserver.TCPServer(("", PORT), Handler)

	print ("Serving at port", PORT)
	httpd.serve_forever()

	#~~~~~~~~~~~~~~~~~~~~~~~~~~~~~~~~~~~~
	# Shuts down and closes when finished
	#~~~~~~~~~~~~~~~~~~~~~~~~~~~~~~~~~~~~
	# httpd.shutdown
	# httpd.server_close()
Ensure you save this .py file in the folder location one level above the globe folder, i.e. alongside index.html, SimpleHTTPRequestHandler is an HTTP request handler that serves files from the
current directory and any of its subdirectories. Your folder should now look like the below: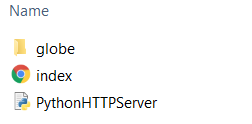 After running this Python code, open Chrome and navigate to http://localhost:8000 You should see the full interactive globe now!
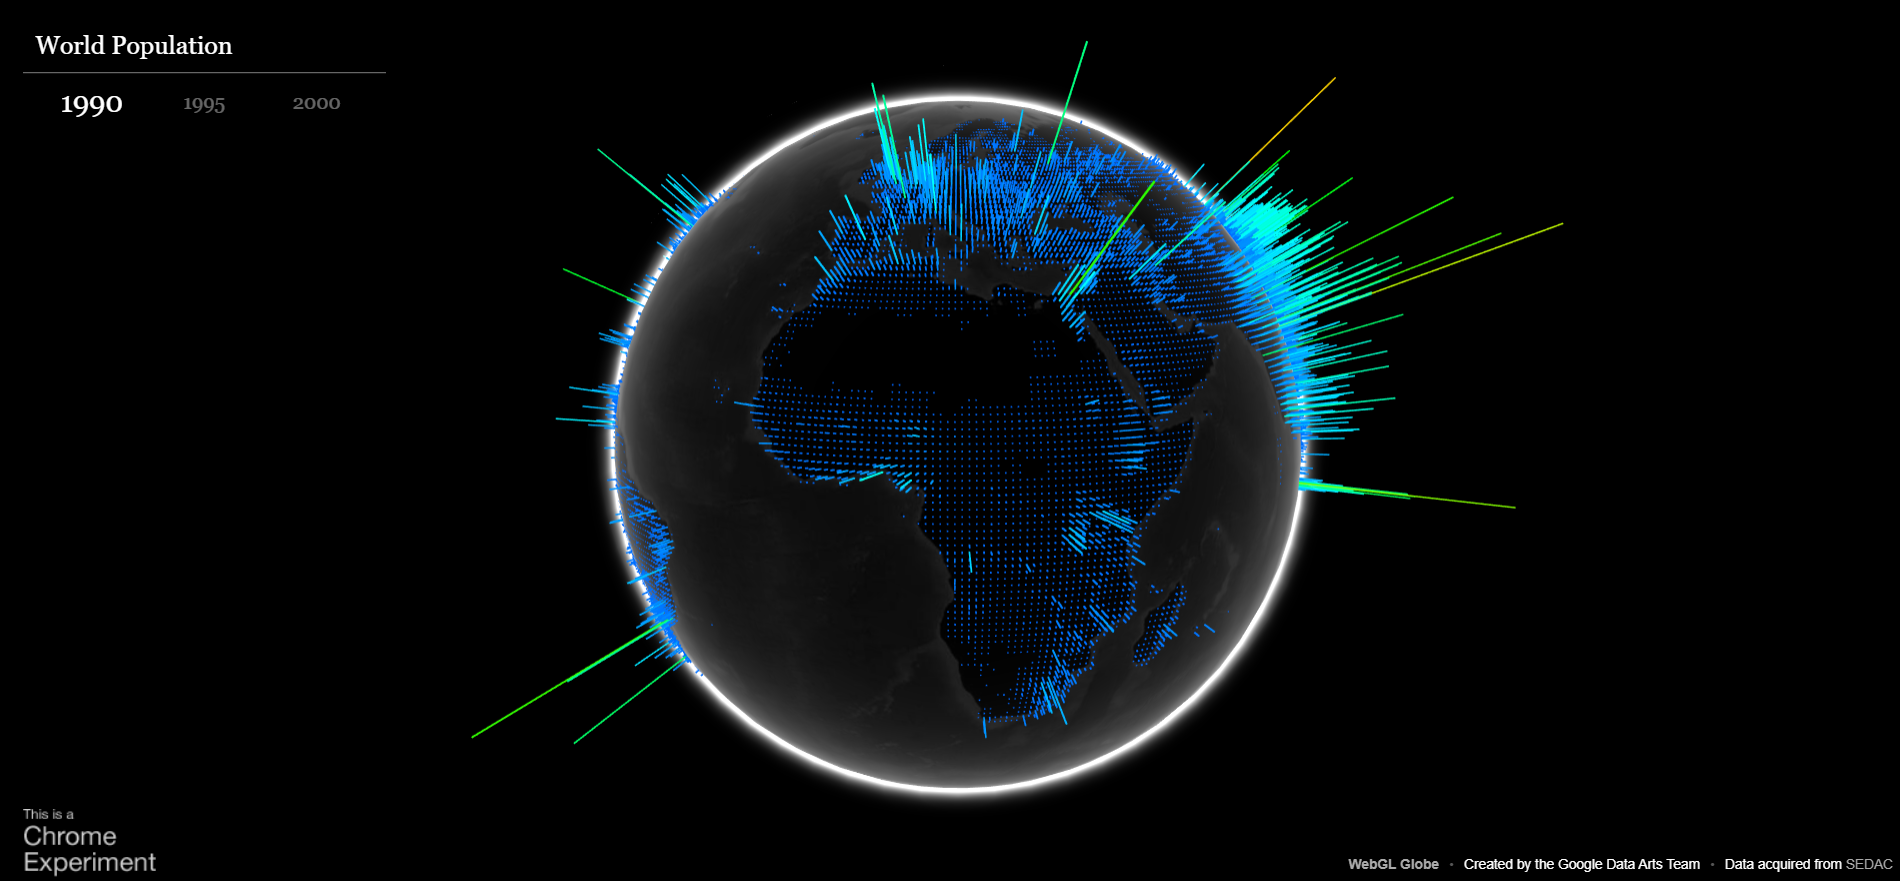
By default the SimpleHTTPRequestHandler will be looking for a file called index.html in the current directory. As you're developing your version of the Globe you can of course rename this file to something more meaningful to you, say to MyFirstGlobe.html, located in the same directory, and then navigate to http://localhost:8000/MyFirstGlobe.html
Step 4:
Customise your version. To do this you will need to alter the index.html file to produce your customised MyFirstGlobe.html file and create a json input data file in the globe folder, say MyFirstGlobeJason.json, that represents the data that you wish to display. There is also some small naming alignment to do to ensure you're referencing the correct json file from your html file. For example if your data looked like Table 1 above then as we saw MyFirstGlobeJason.json will look like the following:[
[ "YearA", [51.5, -0.12, 0.54, -33.8, 151.2, 1.01, -37.8, 144.9, 0.32, 42.3, -71.0, 0.09, 40.7, -74.0, 0.01]
]
]MyFirstGlobe.html will have the below amendments:
Line 112:
<div id="currentInfo">
<span id="yearYearA" class="year"></span >
</div >
Line 135:
var years = ['YearA'];
Line 167:
xhr.open('GET', '/globe/MyFirstGlobeJason.json', true);
After saving all files, navigating to http://localhost:8000/MyFirstGlobe.html will display your customised Globe!